

In 2019, we published part two of WebStrategies’ annual benchmark report blog series to discuss the average bounce rate for credit union websites. However, this metric means something totally different in GA4 than what it was in UA.
In this blog, we’ll dive into what has changed about the bounce rate, how to view it in GA4, and what the average bounce rate is for credit unions.
If you’re interested in our benchmark reports, be sure to check out our 2023 Credit Union Digital Marketing Benchmarks.
- What was the Bounce Rate in UA?
- What is the Bounce Rate in GA4?
- Should Your Credit Union Still Measure the Bounce Rate?
- What Your Engagement Rate and Bounce Rate Are Telling You
- Where to Find Bounce Rate in GA4
What was the Bounce Rate in UA?
Bounce rate in UA (Universal Analytics) represented how often a user came to your credit union’s website and left without visiting another page.
Bounce rate was displayed in a percentage, and you wanted that number to be as low as possible. A low bounce rate in UA indicated that users were looking at more content after landing on your credit union’s website.
WebStrategies found that the average credit union bounce rate was 40.85% in 2019. To make that number more tangible, this means 2 of every 5 people who came to credit union websites left without visiting another page.
This approximately 41% average may seem high to you, but it wasn’t really alarming in the credit union space. This was because many users came to the website to log in to online banking. Even though they continued to the online banking site, Google Analytics counted these users as a bounce.
With this understanding, bounce rate wasn’t a perfect metric in UA. However, it could be made more accurate by setting up Google Analytics tracking to indicate that a user who clicked the online banking log in button wasn’t a bounce.
In other scenarios, users were counted in the bounce rate if they clicked on a loan application immediately following their website visit, which is obviously not a bad thing.
All these issues with bounce rate in UA prompted Google to make changes to this metric in GA4.
What is the Bounce Rate in GA4?
In GA4, the bounce rate is simply the inverse of the new engagement rate. Let’s look into these two metrics in more detail:
- Engagement rate: According to Google, the engagement rate is the percentage of engaged sessions on your credit union website. Google considers an engaged session a session that lasts longer than 10 seconds, has a conversion event, or has at least 2 pageviews or screenviews.
- Bounce rate: The percentage of non-engaged sessions on your website.
As you can see, bounce rate means completely different things in UA and GA4.
Regarding the average credit union bounce rate in GA4, we’re seeing this metric range from values as low as 1.63% to values of 31%. We need to consider that GA4 started processing data just a few months ago, in July 2023, so we may need to wait for a few more months to have more conclusive data about the average credit union bounce rate.
Should Your Credit Union Still Measure the Bounce Rate?
With all these changes, you may wonder, “should I still measure the bounce rate or only focus on the engagement rate?” The truth is that you probably can get around by focusing on your engagement rate. The higher your credit union’s website engagement rate, the lower the new bounce rate will be.
That said, it won’t hurt if you still want to keep an eye on the bounce rate to complement your engagement rate data.
What Your Engagement Rate and Bounce Rate Are Telling You
A low engagement rate or a high bounce rate in GA4 can indicate bigger problems that should be addressed. A high bounce rate acts as a red flag for an engagement problem as site users should be spending more than 10 seconds on your site to learn more about your offerings and consume the content you've added to the site to educate and build trust and loyalty.
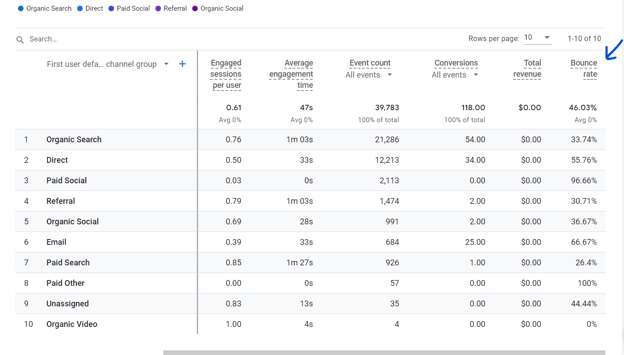
Additionally, you can examine bounce and engagement rates broken down by channel (such as direct traffic, organic traffic, paid search, display, social, etc.) The rates may vary greatly and point you in the direction of an issue.
While a 0% bounce rate is unrealistic, you do want to check to see if a paid channel (like paid search or display) has a particularly high bounce rate. This can be an indication that an advertising or site change may be needed. Put simply, a high bounce rate from advertising is money out of your pocket.
You would also be wise to look at the bounce rate for specific pages on the website. You can look only at the bounce rate for the loan page, credit union blog, or any other page you desire.
Where to Find Bounce Rate in GA4
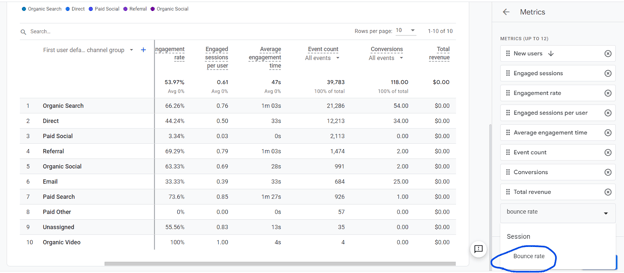
Bounce rate is not a default metric in GA4, which means you’ll have to customize your reports if you want to view the bounce rate. To find the bounce rate in GA4 you have to:
- Click reports.
- Select the report where you want to view the bounce rate.
- Click customize.
- Select the bounce rate in the metrics drop-down.
- Click apply.
- If you want to add this metric permanently to your report, click on the save button.
Once again, remember that you shouldn’t place more emphasis on site engagement metrics like bounce rate or engagement rate than conversion data. While it is helpful to measure these metrics and understand them, they are just one part of the bigger picture in a digital strategy.
If you want to learn more about what’s different for credit unions in GA4, check out our blog below:

Note: This post was originally published on January 22, 2020, with updates on December 7, 2023.


Agree, disagree, or just have something to add?
Leave a comment below.