

We regularly update this article with the latest information pertaining to Digital Marketing Budgets for Credit Unions.
Last update: November 2023
We’ve written extensively about online marketing budgets, and the more we work with credit unions, the more we see that many of the standard marketing budget calculations for traditional B2B and B2C companies do not apply.
Each year, credit union marketers’ goals are to add members and increase loan value and share of wallet. Emerging from the pandemic, consumer behavior changed and marketing spending rebounded, but as interest rates rose in an effort to fend off a recession, data from June 2023 reflects marketing budgets are slightly down compared to the previous year.
All this leaves marketers wondering, how much should be budgeted for marketing? And, which marketing channels are most appropriate for credit union marketing?

In This Article We Discuss
- Examples of Credit Union Marketing Budgets for 2024
- How to Use Historical Data As A Basis Of Budgeting
- State of the Market for Credit Unions
- Which Marketing Channels Are Most Effective?
- Business Objectives Should Be The Key Driver
- Final Thoughts About Developing Credit Union Marketing Budgets For 2024
Examples of Credit Union Marketing Budgets for 2024
We’ve worked with over a hundred different credit unions, which means we’ve seen a lot of different scenarios in terms of credit union assets, membership size, and marketing personnel. This expertise gave us the necessary insights to determine the optimal overall marketing budget for credit unions and where to spend it.
For example, if your credit union assets are $600,000,000, you have around 60,000 members and two employees in your marketing team, you should spend at least $28,506 on digital marketing every month (excluding personnel costs).
In the table below, you can see an example of the low and high ends of the monthly budget for all your marketing initiatives and digital marketing specifically:
SUMMARY |
LOW ANNUAL |
HIGH ANNUAL |
| Total Marketing Budget (excluding personnel) | $59,386 | $80,346 |
| Digital Marketing Budget (excluding personnel) | $28,506 | $54,636 |
We’ve seen an example of a credit union marketing spend, but where should you spend that money? In the table below, you can see a detailed breakdown of the digital marketing budget for our example:
ADVERTISING |
LOW ANNUAL |
HIGH ANNUAL |
| - Search Advertising | $8,266 | $15,844 |
| - Display Advertising | $2,280 | $4,370 |
| - Social Advertising | $1,140 | $2,185 |
| Online Advertising Total | $11,687 | $22,400 |
The good news is that now you can calculate your optimal credit union marketing budget in seconds using our credit union marketing budget calculator. Simply click the button below, enter your details, and you’ll receive the same data we used in the example, but with numbers that are true to your credit union’s specific characteristics and needs.
How to Use Historical Data As A Basis Of Budgeting
When crafting your marketing budget for 2024 and beyond, begin by analyzing the previous year’s budget and performance. Based on last year, assess what performed well, and reduce funds to the areas that underperformed.
Identify what channels delivered the highest return on investment. To evaluate the channel with objectivity and understanding of overall industry performance, consider that factors such as the creative and copy, as well as the timing of advertising messages, impact the channel’s success and ROI. In other words, don’t dismiss the channel for poor performance unless it received the full effort.
State of the Market for Credit Unions
In 2022, most US communities emerged from lockdown; kids are in school, trade shows, sporting events, concerts, and festivals are well-attended, and friends and families are gathering fairly normally. Most importantly to marketers - after a few years of necessary digital-only experiences, a Forrester report found consumers are choosing hybrid experiences that blend face-to-face and digital interactions over digital-only.
But 2022 was also a time of uncertainty for credit unions because the Fed’s interest rate hikes to temper inflation and ward off an economic recession meant loan volume would likely decline and the credit unions we spoke with were already preparing.
The March 2023 CMO Survey showed marketers were still more confident than during the worst of the pandemic but optimism remains weaker than in 2021, and relatively flat compared to 2022. For lenders like credit unions, whose loan volume hinges on interest rates, pivoting product promotions for revenue is vital.
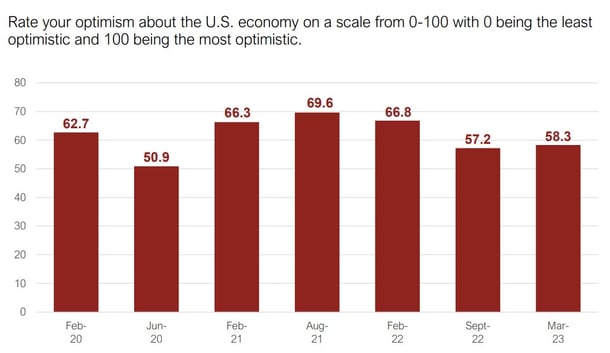
Source: March 2023 CMO Survey
According to an eConsultancy article, The Future of Marketing, 49% of respondents expected marketing budgets to increase. This is down from 2022, when 60% of respondents said budgets would increase. The report cites the biggest increases in budget to be in data and insight capability, technology and infrastructure spending, and strategic initiatives.
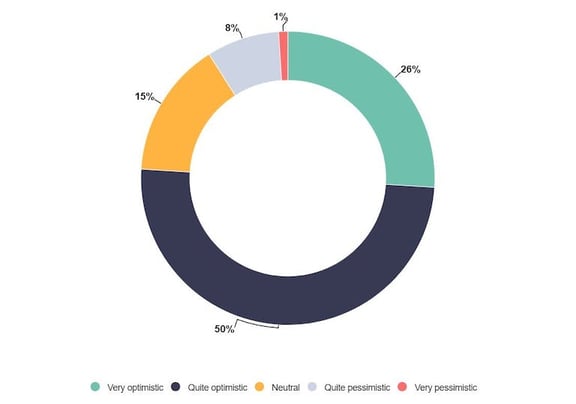
Seen on: The Future of Marketing’s article
How should your 2024 marketing budget compare to previous years?
Because of the volatility of the past two years and uncertainty about the future, comparisons should only be a portion of the considerations that go into your budget planning. According to Peter Wright, Chief Marketing Officer at Specsavers, "The next few years should be a tremendous opportunity for marketers.”
He continued, “We’re going through tough economic times with lots of changing consumer behaviors. This means that if you can truly understand what consumers are thinking about and show that you’re driving the growth in the targeted areas, and you can get your whole business behind it, then this should be the time when marketers shine,” reiterating that while the market may be tough, it’s critical to have an effective marketing team by your side that can drive growth to your business and avoid long-term market loss.
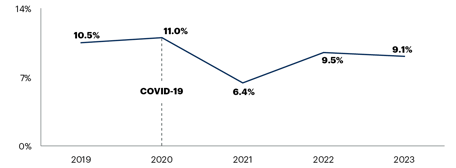
After marketing spending coming back up in 2022, in Gartner’s report The State of Marketing Budget and Strategy in 2023, CMOs indicate a slight decrease in marketing budgets to 9.1%; 4% less than 2022. And the financial sector shows an even greater decrease in marketing budgets to 7.5% in 2023 compared to 10.4% in 2022.
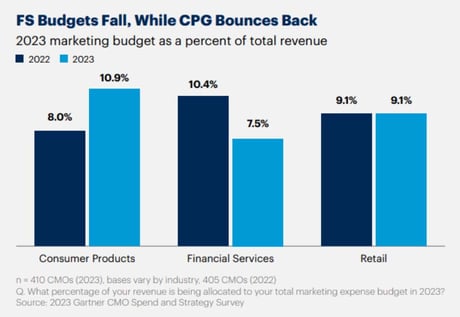
The financial services sector is expected to have the largest budget decrease in 2023 at 7.5% of revenue, up from 10.4% in 2022, according to Gartner's The State of Marketing Budget and Strategy 2023 report.
Credit unions will respond in a variety of ways to economic uncertainty however it will be more important than ever to continue marketing in order to promote products and services that suit consumer needs and stay ahead of competitors on market share and share of wallet.
Compare Your Budget Against What Other Credit Unions Are Spending
Evaluating what other credit unions are doing can be helpful, though there is considerable variance from one organization to another when considering the size, location, competition, charter, and other factors.
In a Financial Brand study published in 2019, the average credit union marketing budget as a percentage of assets was 0.12%. In 2018, 67.9% of the sample group spent over 0.10% of assets on marketing, versus 53.3% in 2015.
As you might expect, a higher percentage of assets is generally spent by smaller credit unions. In 2018, credit unions with less than $500 million in assets allocated an average of 0.13% to marketing, while credit unions worth over $10 billion in assets spent 0.09% of that. Other factors come into play such as how competitive your local market is, how aggressive your growth strategy is, and how well-known your brand has become.
When expressed as an amount spent per member, in 2018 the average marketing budgets ranged from $11.61 to as much as $20.19 per member. This amount can vary widely, with some outliers spending a whopping $203 per member to as little as $.05 per member, but somewhere in the average range is where most credit unions will want to aim for.
Of course, the amount spent per member is a much different figure than the amount invested per net NEW member. The average investment for that is much higher, at an average of $281.
When broken down further into advertising dollars, we've found that among our extensive group of credit union clients, the average advertising spend per member per year is $1.16, with the highest spend among our clients being $3.60 per member and the lowest is $0.21.
As advertising spend relates to asset size among our clients, we're seeing an average spend of $91.13 per million in assets per year, with a high of $319.15 per million and a low of $20.13 per million.
Not surprisingly, there is a strong correlation between the amount of per member marketing dollars invested in a credit union membership growth strategy, and membership growth.
Credit Unions Attracting Younger Members
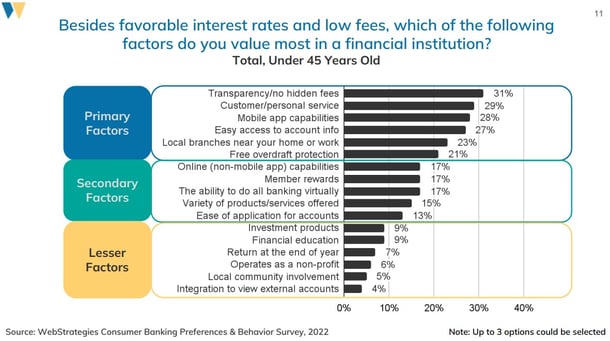
Many credit unions we speak to mention attracting younger members (millennials) as a key objective. So WebStrategies commissioned a study to learn what matters most to banking consumers. In our Consumer Banking Preference & Behavior Report, we found that people under 45 years old are the most interested in features such as no hidden fees, customer/personal service, mobile app capabilities, easy access to their account, and free overdraft protection. Advertising messages should be tailored to this age group accordingly.
While credit unions take great pride in the financial education and community involvement they provide, these are not factors that resonate with the younger age group so marketers promoting the features will likely not see a great return on investment.
Don’t overlook Generation X, who is currently considering their options for financing their children’s college, and caring for their aging parents while trying to bolster their retirement funds.
To connect with both Gen X and the elusive millennials, being selective with the online channels is smart but the marketing message needs to resonate. To attract both audiences, allocate more for creative development and campaign management targeting the audiences separately across more digital channels simultaneously.
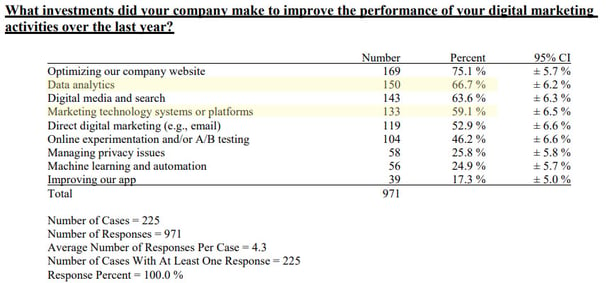
Respondents to the September 2022 CMO Survey marketing technology systems and data analytics in the top four priorities for digital marketing investments to improve performance in the last year.
Investing in Marketing Technology
According to a Forrester Research report from April 2018, US marketers planned to increase their investment in marketing technology by 27% over the next four years. Forrester projected that marketing technology will account for 30% of total marketing spending in 2018, and an August 2018 report by Gartner aligned with that, with marketing leaders reporting that they expected to spend 29% of their marketing budget on marketing technology in 2018, up from 22% in 2017.
Within marketing tech, the areas of highest investment growth, according to Forrester, are data, ad technology and marketing automation.
As noted above, investment in digital technology was accelerated by the virtual nature of most interactions during the past pandemic.
In a eConsultancy article about The Future of Marketing Survey 2023, 75% of marketers say their organizations are already using or considering generative AI tools.
There’s both fear and excitement around how AI can help accomplish marketing initiatives more effectively, but what remains clear is the importance of assessing how this technology can help meet your credit union goals.
Which Marketing Channels Are Most Effective?
This is a question we get all the time, and as you might expect, the answer depends.
Looking at our 2022 Credit Union Marketing survey, marketers shared the tactics that were most successful. Email, SEO, content marketing, and paid search came out on top.
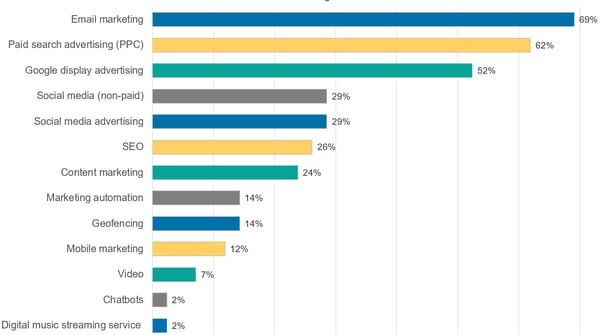
For several years, email marketing has led the channels as one of the most effective tactics for credit unions. Paid digital advertising including display and social media is effective at reaching untapped prospects. SEO and content marketing work in lockstep to attract visitors with desirable content that search engines serve when the search terms match the website content.
Social media has evolved from a mediocre source of leads using organic posting, to one of the more successful channels for engaging new leads as well as existing members, using the precise targeting capabilities of paid social advertising. Visit our article to read more about how much credit unions should spend on social media marketing.
As online advertising platforms have become more sophisticated, and targeting has gotten better, categorizing all online advertising that is not paid search as online display is misleading.
In our experience, we’ve had great results with email marketing for cross-selling and retention. Paid search can be a very successful tool for account acquisition. And the various forms of online display can be powerful for branding, acquisition or cross-selling depending on the exact channel, campaign objectives, and targeting.
SEO is critical for Local Credit Unions
Local search results have to be well maintained in order for credit unions to appear in the market in which they are located. Ensure Bing and Google Business listings for each branch location are complete because it significantly impacts the website ranking for obvious non-branded, local searches (like Richmond, VA credit unions). For the best chance to rank in local search results, including Google Maps, the local listing (such as Google My Business - GMB) information needs to be accurate and include all the requested information, such as branch hours.
Plan on investing about 3-5 hours per branch location to get the core local SEO items done right.
Business Objectives Should Be The Key Driver
The best approach to budgeting would be to first consider all of your business objectives and to have the right system of measurement in place to accurately determine your acquisition costs.
For example, let’s say your credit union has a goal to originate $4 million in new home loans this year. If you can confidently forecast that mortgage applications can be obtained at $200 each through paid marketing channels and your average mortgage is $200,000 and applications close into funded loans at a rate of 10% (then each funded loan actually costs you about $2000 each to acquire). It would take 20 loans of $200,000 to reach your $4 million goal. So you could expect marketing costs of $40,000 to achieve that objective (20 new loans at a cost of $2000 each).
These types of calculations require knowledge of and access to both internal data (like average loan size, and loan funding rates) as well as complete and accurate digital marketing data. If you don’t know how to track digital marketing performance, you’re at a heavy disadvantage when it comes time to develop budgets and secure C-suite and board approval.
Marketers have regularly expressed concern over their ability to measure returns from online marketing channels. Credit unions are slowly getting better at measuring ROI though, and getting better at marketing effectively.
Because tracking has gotten more sophisticated, many credit unions are now able to much more accurately measure the results that matter, from the lead source to the funded loan amount. The LOS provider plays a large role in how extensively credit unions can track this data. We recently published an article expanding on those differences- The Best Loan Origination Software for Credit Unions | Tracking Marketing ROI.
Final Thoughts About Developing Credit Union Marketing Budgets For 2024
It will be essential in the year ahead to plan and execute your marketing spending very strategically—there is no room for wasteful spending when marketing budgets are still under so much scrutiny.
If you don’t have a good handle on your website and online campaign tracking, commit to investing in setting up the proper systems of measurement and good quality dashboard reporting. Credit unions we talk to continue to rate results tracking as a top priority that has been difficult to solve.
Identify your target market and invest in developing buyer personas so your marketing can connect with their unique pain points and motivations.
Diversify your marketing tactics and look for creative solutions to reach your target audience(s) in new places and to find new acquisition channels in the year ahead.
Many organizations will spend more than 50% of their marketing budget online in 2024. Will yours?
Calculate your ideal marketing budget in seconds:
You may also be interested in:
Credit Union Marketing Resources
Note: This post was originally published on September 28, 2022, with updates on November 2, 2023.


Agree, disagree, or just have something to add?
Leave a comment below.