The right marketing plan requires knowing your audience deeply. Marketing to younger, less affluent males is different than marketing to affluent, older females.
While there is no shortage of data about how people behave online, we wanted to better understand how central Virginians behave. To do this, we created our own report.
Over the last several months, we surveyed central Virginians about how they use the internet. We then broke down that information by age, gender, and income.
Today, we’re specifically looking at how income impacts online behavior in central Virginia. Below are several key observations and takeaways from this report.
While we are primarily focused on how income levels affect online behavior, we have also included data for television consumption (a major competitor for the online space).
Keyword Searches
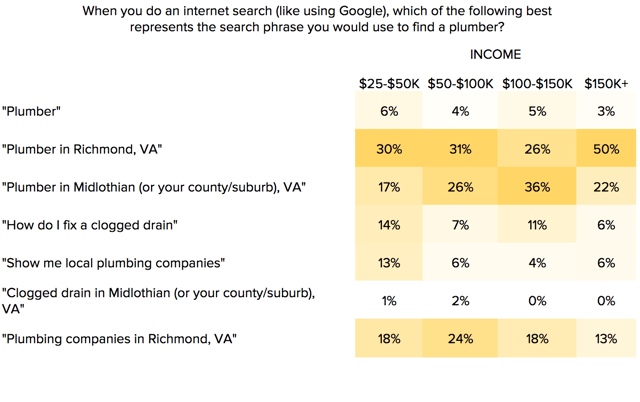
Regardless of income level, central Virginia’s search in a similar way. If searching for a local plumber online, the most common way to search is, “plumber in (town/city, state). “Show me” searches (e.g. “show me plumbers in richmond va), are only used by a small segment of the population. It is worth noting lower income earners are twice as likely to use “show me” searches than any other income level.
Paid versus Organic
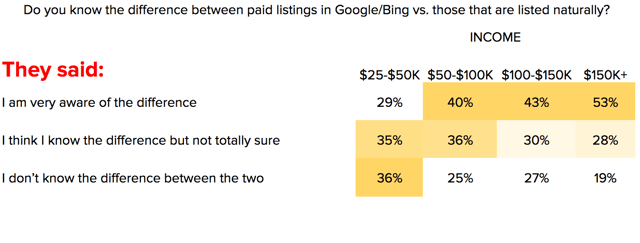
The more affluent the individual, the more likely they are to understand the difference between paid and organic search listings. More than half of those individuals making over $150k know the difference, versus less than one third of those making below $50k.
Hours Spent Watching TV Per Day
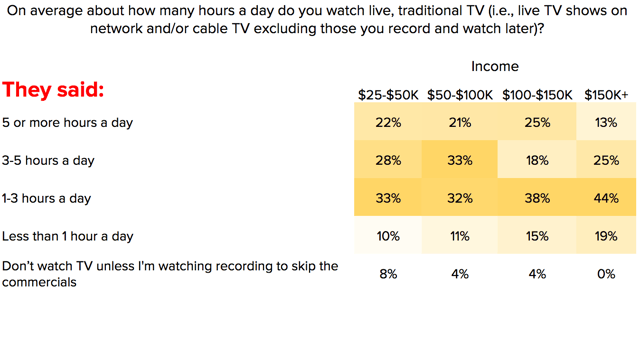
High income earners spend the least amount of time watching TV. Nearly two-thirds spend zero to three hours per day online, compared to less than 50% for those making less than $100k/yr.
Hours Spent Online Per Day
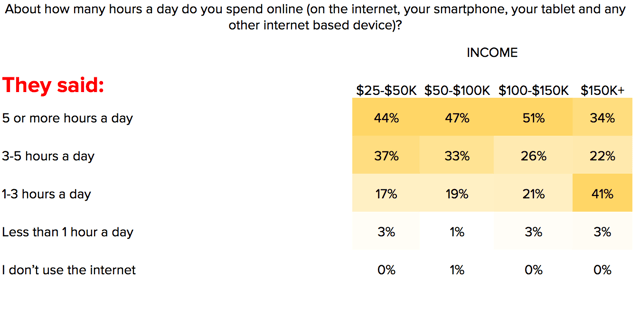
Similar to television, high income earners spend less time online than any other income segment. Only one third of those making $150k per year spend more than five hours per day online, compared to between 44% and 51% for every other income level.
Using A Company Specific Mobile App
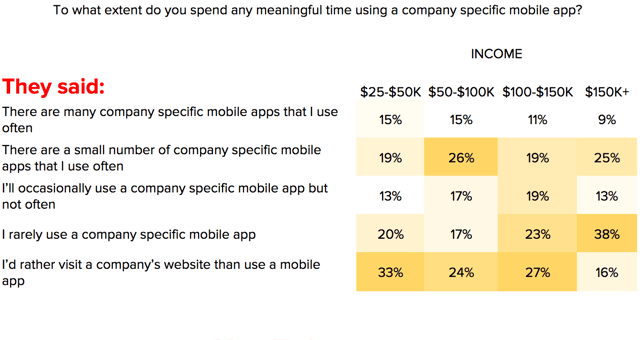
Nearly 50% of every income level admits to using a company specific mobile app at some level.
Of those who claim to use a company specific mobile app, most only use a small number of company specific apps regularly. Less than 15% of every income level uses several company specific apps on a regular basis.
Visiting a Website That’s Not Mobile Friendly
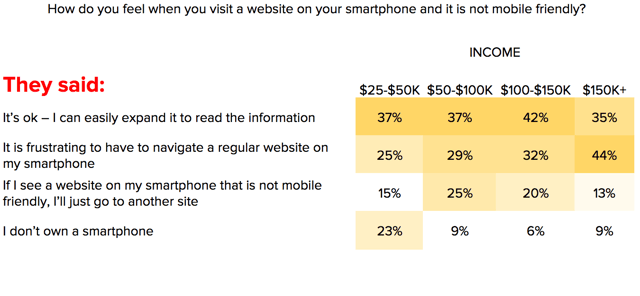
High income earners are the most frustrated by a non-mobile friendly website, while lower income earners appear to be more tolerant. Over one third of every income level will tolerate a non-mobile friendly website. Meanwhile, 23% of those making between $25-50k/yr claimed they did not own a smartphone at all; compare this to less than 10% for all other income levels.
Banner Advertising on Mobile Websites
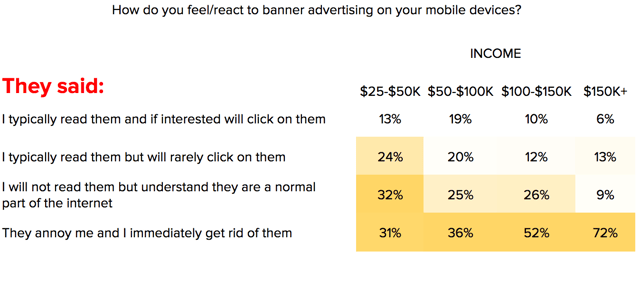
Lower income earners are more tolerant of banner advertising on mobile sites; recognizing they’re a normal part of the internet. Higher income earners are far less tolerant, with 72% claiming they are annoying and will quickly get rid of them. Approximately one third of those making between $25-100k feel the same way.
Clicking on Banner Ads
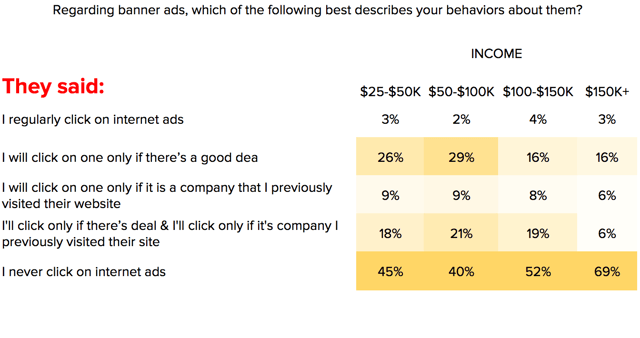
Higher income earners are less and less likely to click on banner ads. Over 50% of those making more than $100k year claim they never click on banner ads, compared to 40% of those making between $50k and $100k. Similarly, over one quarter of those making less than $100k/yr say they will click a banner ad if given a compelling reason, compared to 16% of those making more than $100k/yr.
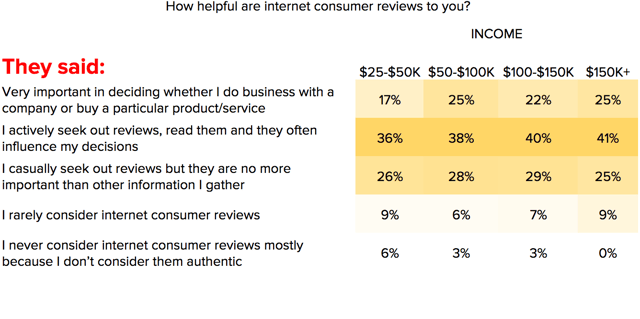
How helpful are Consumer Reviews?
Income has no notable impact on interest in consumer reviews. Between 46% and 59% of central Virginians said they are impressed but consumer reviews, but wonder if the business is as good as the reviews suggest. Those making less than $50k per year are slightly less skeptical of user reviews than other income levels.
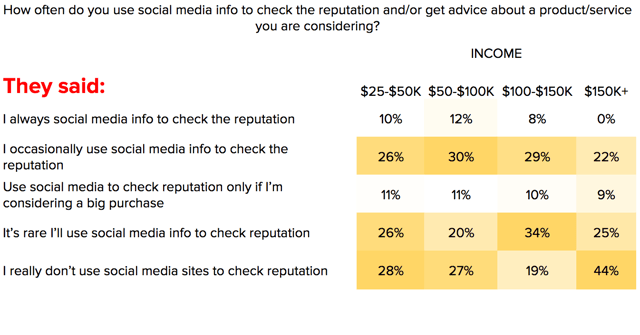
Using Social Media to Check a Company’s Reputation
The highest earners are least likely to leverage social media for researching the reputation of a company. Between 36% and 42% of those making less than $150k per year will check social media to check the reputation of a local company. This number falls to 22% for those making more than $150k/yr.
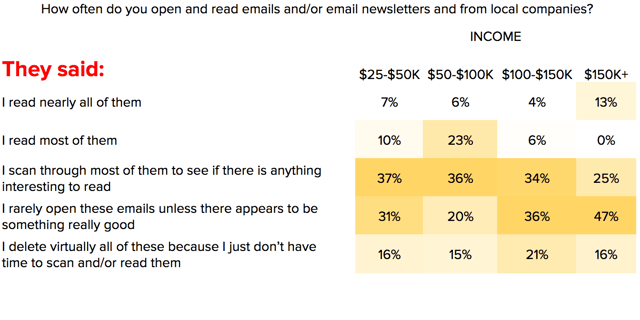
Reading Emails From Local Companies
Over 50% of those making less than $100k will at least scan through email marketing from local companies. This behavior drops slightly for those making more than $100k per year.
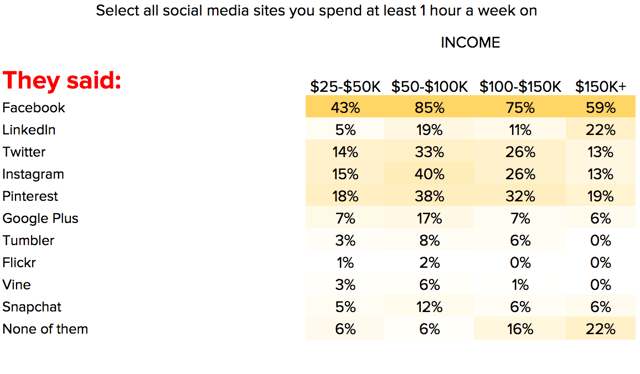
Social Media Site Usage
Facebook is by far the most used channel for all income levels. Facebook is used the least by those making between $25k and $50k per year. However, it is still used by 43% of this segment. Twitter, Instagram, and Pinterest are the second most popular social media channels after Facebook. Snapchat is still only used by a small percentage of the population. Of all income levels, the $50k to $100k demo is most likely to use Snapchat (12%) compared to all other income levels (5-6%).
In summary, income level can greatly impact how often the internet is used for both entertainment and information. Generally speaking, the more money someone makes, the less time they spend online, and the less they use it as a resource. This can be correlated to age, where older demographics are far less likely to use the internet compared to younger individuals who grew up with the internet. It can also be attributed to life demands, where those making more money have less leisure time, and therefore less time to spend online.
Looking for more? Download the full 32-page report, which features more questions, more demos, and more insights.



Agree, disagree, or just have something to add?
Leave a comment below.