
We regularly update the following post with the latest information pertaining to Digital Marketing Budgets.
Last update: November 2022
This article provides information that can guide you about how to budget for marketing and where to invest your marketing dollars.
Included in this article are:
- How much are companies spending on marketing?
- Where are marketing dollars invested offline and online?
- What marketing strategies and tactics are getting results?
- How have companies adjusted their marketing spending as the U.S. emerges from a pandemic?
The answers to these questions come from reliable sources including:
- an annual survey of Chief Marketing Officers (CMOs) from a variety of industry sectors and firm sizes
- a leading research group report about interactive (digital/online) marketing trends and predictions
- other leading digital marketing research firms
This post is broken down into the following sections:
- Overall Changes In Total Marketing Budgets
- How To Allocate Marketing Budgets Across Channels
- Which Marketing Strategies & Tactics Are Getting The Best Results?
- Changes in Traditional Versus Digital Marketing Spend
- What Percentage of Marketing Budget Spent On Digital?
- How Much Should Your Firm Budget For Marketing?
(short on time? Skip to the bottom for the tl;dr)
Marketing budgets vary by industry. Looking for specific information for one of the industries we specialize in? Check out our articles on:
Credit Union Marketing Budgets
Manufacturing Marketing Budgets
USE OUR EXCLUSIVE 2023 BUDGET CALCULATOR
Changes In Total Marketing Budgets
First, a look at how marketing budgets are changing.
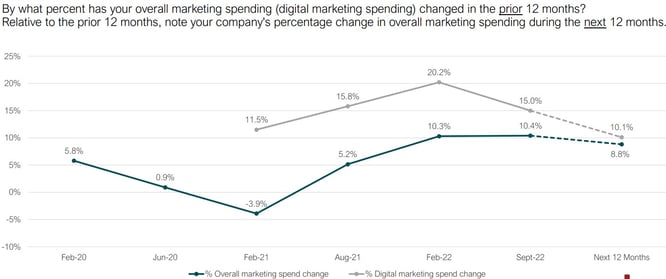
Each year in the CMO Survey, top marketers are asked how their marketing spend is expected to change in the upcoming year.
The February 2022 CMO survey indicated that marketing budgets were expected to increase by 10.3% in the next 12 months compared to the previous year.
However, the latest survey from September 2022 showed marketing spending growth is slowing; likely due to rising inflation and the Federal Reserve’s action to increase interest rates that are causing uncertainty in the U.S. economy.
You can download the full CMO Survey reports here.
Marketing budgets as a percent of the overall firm budget have dipped in the second half of 2022 as shown in the chart below; decreasing to 8.7% according to the September 2022 CMO Survey.
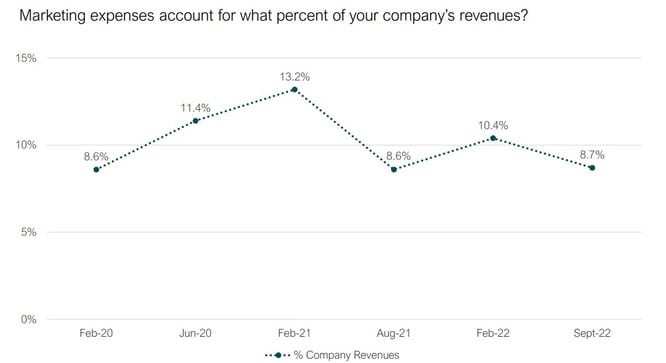
After reaching a high of 13.2% of company revenue in early 2021, marketing budgets declined to 8.6% in the August 2021 report. This is considered to be a reflection of rising firm revenue that outpaced marketing spending during this period of inflation and continuing supply and demand considerations. However, the September 2022 decrease is likely due to marketers being cautious over concerns of the economy.
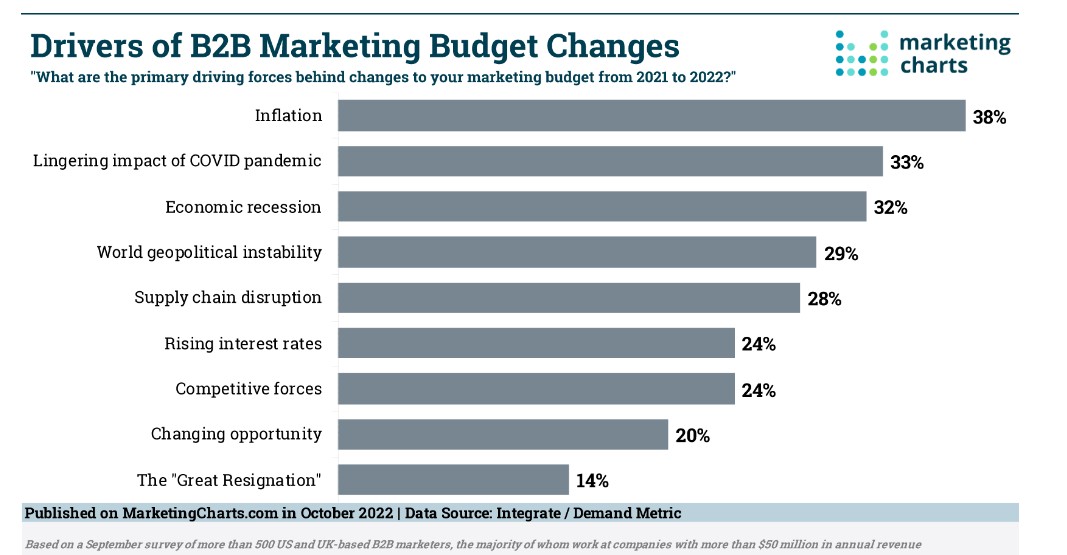
A Marketing Charts survey in September of 2022 showed that inflation is a primary driver of marketing budget changes, as well as the lingering impact of the COVID pandemic and economic recession. The study found that 42% are increasing their marketing budget while 32% are decreasing their budget.
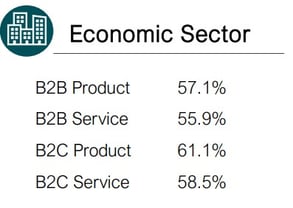
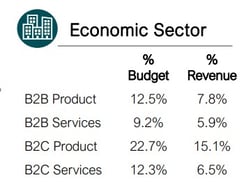 Marketing budget as a percent of total revenue can vary dramatically by industry. While the B2C product sector devotes an average of 15.1% of revenue to marketing budgets, the B2B product sector reports a much lower 7.8% of revenue dedicated to marketing spend.
What is included in marketing budgets?
One of the difficulties in providing a general budget recommendation is that not all companies are consistent with what they include in their marketing budget. While some companies include any marketing, and even sales-related expenses, others would categorize some of those expenses separately as a part of their total firm budget. The chart below illustrates these inconsistencies and shows the marketing expenses most commonly included.
| Direct expenses of marketing activities | 95.7% |
| Social media marketing | 92.9% |
| Brand-related expenses | 81% |
| Marketing employees | 80.4% |
| Marketing analytics | 73.4% |
| Marketing research | 71.7% |
| Overhead costs associated with marketing | 69% |
| Mobile marketing | 59.8% |
| Marketing training | 52.2% |
The 2022 CMO Survey reports 59% of companies list marketing technology as one of their top digital marketing investments. A 2022 study by Gartner reported that marketing leaders planned to spend 25.4% of their marketing budget on marketing technology in 2022 (down slightly from 26.6% in 2021). Paid media is the largest resource allocation for CMOs at 25.7% followed by labor, and then agencies and services. Email marketing platforms, web content management, and digital marketing analytics platforms were the highest martech priorities.
How to Allocate Your Marketing Budget
The next question to answer is how to allocate marketing budgets across channels – offline and online—and how to spread the online investment across the various online/digital channels.
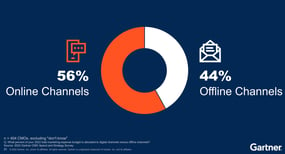 Gartner shows the estimated allocation of marketing funds offline vs. online and across the digital channels as 56% to digital channels and 44% to offline channels.
Here are some conclusions from the reports:
- 2022 marketing budgets increased as a percent of company revenue to 9.5% from 6.4% in 2021.
- After two years of digital spending approaching 70% of marketing budgets, the allocation of digital and offline spending has shifted to a more equitable split as people are engaging more at events and in person.
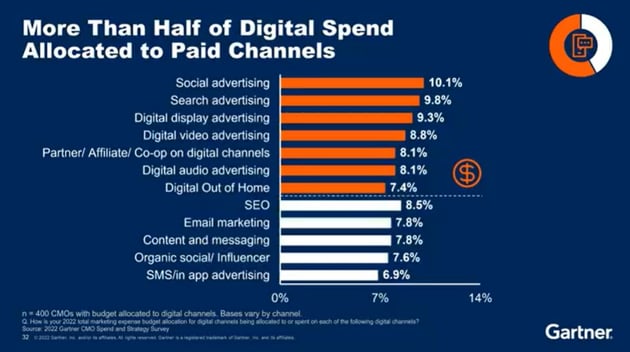
- More than half of digital spending is being allocated to paid channels like social, search, display, and video advertising.
- SEO, content marketing, and email marketing drive the earned digital channels.
- Mobile marketing has grown to a point that it’s no longer tracked separately in the forecast and it’s presumed to be considered across all channels
 How marketing funds are ultimately allocated is driven by the nature of the business, the competitive marketplace, and how targeted customers behave through the buying funnel.
Across industries, Gartner reports that branding will receive equal funding to engagement and performance marketing.
When it comes to offline marketing, event marketing and sponsorships accounted for the largest portions of the offline budget.
Which Marketing Strategies & Tactics Are Getting The Best Results?
Email marketing still holds the crown with the highest ROI reported, due in part to its relatively low cost.
Paid digital advertising on search and social media also produces impressive ROI results, and investments in SEO can pay off with a very high rate of return, albeit at a slower pace.
Marketing technologies and automation are proving effective at bringing together the most effective marketing tactics (email marketing, organic search, social media marketing and content marketing) to achieve better results.
Which Social Media Channels Should I Invest In?
Two studies from Insider Intelligence from November 2021 and April 2022 show that while Facebook and Instagram have the most users in the U.S., TikTok, and YouTube lead the way for average time spent per day spent on the platform.
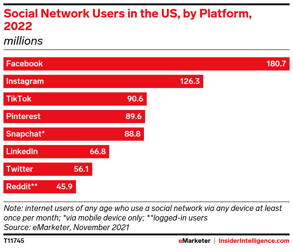
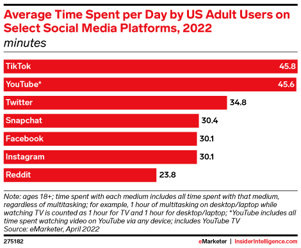
While there are no direct investment assessments associated with these studies, they show noteworthy trends among the major social channels, and suggests an emphasis should be made on TikTok, YouTube, Facebook, and Instagram channels for social advertising.
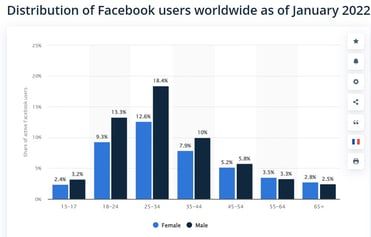
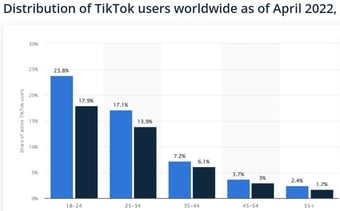
The age and intent of your desired audience is the primary factor in choosing a platform and B2C companies are more likely to reach their target audience on social channels than B2B. While TikTok users skew towards the under-25 age group and Facebook and Instagram users tend to be older, the ability that each platform has to target ads should allow any platform to be used regardless of the age range of the majority of users.
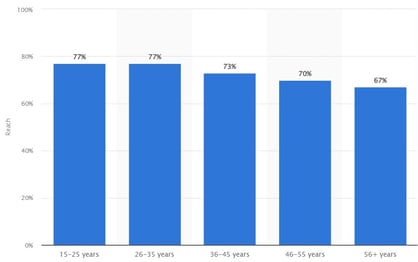
YouTube’s audience is more widely spread across age groups in that a report from Statista shows over 60% of internet users in every age group use YouTube.
 Many of the lesser-used social platforms can be effective tools in an advertiser's toolbelt as well, depending on the target audience.
Changes In Social Media Platform Investments
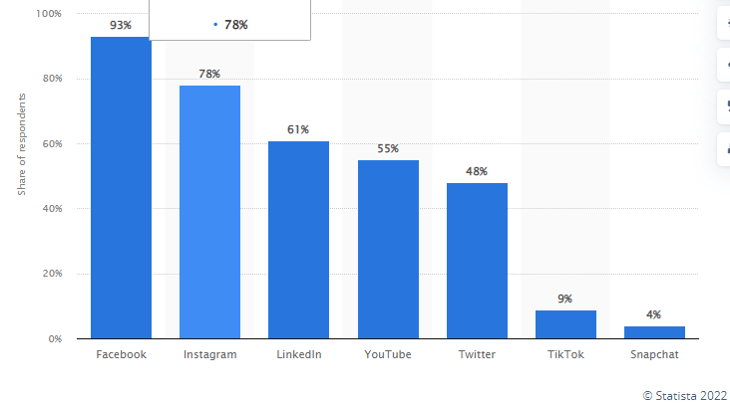
Social media ad spending is expected to reach an astounding $56 billion in 2022, according to an eMarketer survey in late 2020.
In a study by Statista published in August 2021, Facebook represented the largest share of that paid social pie, with 93% of marketers currently investing in Facebook. That is compared to 91% reported in 2019, when 26% of survey respondents reported that they planned to spend less on Facebook in the coming year. It appears that despite controversy and changes to the platform, Facebook remains a platform where almost all marketers are paying to play.
Instagram, by comparison, saw an increase in usage from 69% in 2019 to 78% in 2021. In the B2B space, LinkedIn has come on strong, rising from 45% usage in 2019 to 61% in 2021.
Changes in Traditional Versus Digital Marketing Spend
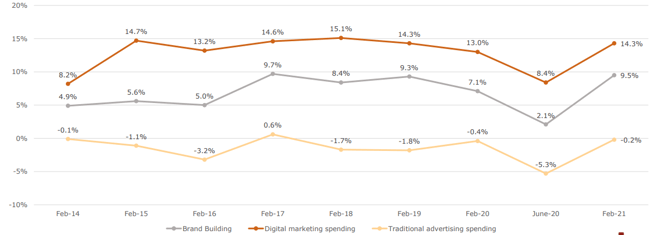
This chart, from cmosurvey.org in February 2021, shows the sharp contrast between digital growth and offline decline.
For the past several years, investments in traditional advertising have consistently dropped by single-digit percentages each year.
Digital marketing spend, by comparison, has consistently grown by double-digit increments year after year.
Businesses are shifting their marketing spend in a big way, and that isn't slowing down. What used to be spent on radio, television, and newspaper is now being spent on search, email, and social.
This trend is expected to continue for the next several years.
A few years ago, digital media spending surpassed TV advertising spending for the first time. That gap has rapidly widened—2019 marked another significant milestone, with digital ad spending surpassing all traditional media ad spend combined.
In 2021, digital spend was projected to more than double television spending. The point is, if you're not investing heavily in digital marketing, you're being left behind by your competitors and you're missing a huge opportunity for visibility to your prospects and customers.
Percentage Of Marketing Budget Spent On Digital
Digital spend is only a portion of total marketing spend for most businesses. Businesses that rely more heavily on the internet to generate sales (e.g. an e-commerce business), invest a greater percentage of their marketing budget towards digital.
While a recent Forrester Research report projected that digital ad spending would make up 46% of all ad spend in 2021, this number can vary depending on a variety of factors including industry, growth plans, and local market.
For more traditional businesses, which rely on offline AND online activity to fill the sales funnel, a healthy mix of marketing investment is to be expected.
Over the last several years across all sectors, digital marketing budgets have increased consistently, while traditional channels have lost ground. However in 2022, the allocation has a more equitable balance as events such as tradeshows are restored and taking a larger portion of the overall marketing budget.
CMO Survey Percent of Marketing Budgets Allocated to Digital Channels by Type
 B2B companies tend to be slower to transition to a more digital model, but B2B only lags 5 percentage points or less behind B2C in September 2022 according to the CMO Survey. Industries with higher-than-average digital spending include Communications/Media (90.0%), Consumer Services (86.7% ), and Technology (70.3%).
How Much Should Your Firm Budget For Marketing?
The CMO survey offers some answers. In the charts below you’ll see how marketing professionals from all types of firms responded to this question.
Marketing budget as percent of firm budget and company revenues
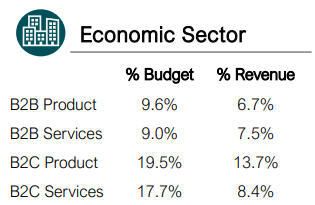
The main takeaways from this survey are as follows:
- For B2B firms, marketing budgets as a percent of firm revenue fell within the 6-8% range
- For B2C firms, marketing budgets as a percent of firm revenue were around 8-14%
- Marketing budgets as a percent of overall firm budgets have been fairly consistent for B2B firms the past few years, in the 9-11% range, but average much higher for B2C companies, up to as much as 20%.
It is important to note that these percentages represent the total marketing investment, not just advertising or media spend.
They include things like marketing staff, customer relationship management, investments paid to agencies and other outside suppliers, advertising costs, media spend, etc.
Firms seeking to grow market share will likely be on the high side of these averages vs. firms planning for modest growth, which may be on the lower side.
Additionally, the competitive nature of a certain marketplace will influence where a particular firm falls among these average figures.
Marketing & Digital Budget Summary - What Does It All Mean?
We purposely compile surveys from a variety of sources over a number of years to give you an objective perspective and appropriate context.
The conclusions of each survey are not always consistent.
This inconsistency represents the diversity of business needs and the marketing strategy that accompany them.
That being said, the overarching themes from the above studies are as follows:
- Marketing budgets are increasing over the past several years
- The allocation of marketing budgets to digital channels has returned to closer to pre-pandemic levels in a hybrid style to meet the target audience preferences
- Total marketing budgets are between 6 to 14% of total revenue
- B2Cs generally spend more on marketing compared to B2Bs
- Smaller companies spend more on marketing as a percentage of their total revenue
- More mature marketers tend to slow their marketing spend as better results measurement enables them to spend smarter, and they often acquire more brand awareness
- Search and Display marketing represent the lion’s share of digital budgets
Bringing together the data from these credible sources in the marketing community should help you determine how much to spend on marketing, and where to apply those investments.
At WebStrategies, Inc, we know your marketing investments should result in profitable sales.
Learn more about how online/digital marketing methods such as inbound marketing, Google Analytics, display advertising, and web design and development can help you achieve your sales goals.
Where do you get the most bang for your buck when it comes to your marketing budget? Let us know in the comments section below.
You may also be interested in ...
2023 Digital Marketing Budget Calculator
What Is A Good Marketing ROI?
What Is A Good Cost Per Click?
Industry-specific budgeting information ...
Credit Union Marketing Budgets
Manufacturing Marketing Budgets


Agree, disagree, or just have something to add?
Leave a comment below.