

A new Google Analytics feature will allow users to link digital marketing efforts to physical location traffic. The feature, called “Store Visits”, tracks the number of people who visit an organization’s physical location after a session on the organization’s website.
Store visits are counted if the user walks into the physical location within 30 days of the online session.
This feature is currently in beta mode and not yet available to all Google Analytics users, but this could be an exciting insight for credit unions.
What Store Visits Data Means for Credit Unions
Credit unions will be able to see how digital marketing efforts affect foot traffic. They will be able to see almost in real-time if digital marketing campaigns are bringing people into their branches (store visits data for a given date pulls in one day later).
Perhaps a community-based credit union launches a campaign with the goal of increasing membership and immediately sees an uptick in store visits in Google Analytics. They would be able to infer that the marketing campaign was to credit for the increase in foot traffic to their branches.
Another scenario would be watching a steady decrease in store visits over time. This could mean that potential and existing members are meeting their needs through online and mobile banking. This challenges the credit union’s marketing team to strategize ways of optimizing these resources further. Would the site benefit from a chat feature? Perhaps texting should be implemented to increase mobile use.
How to Read a Store Visits Report
The Store Visits report is found under the “Conversions” section of Google Analytics. This is what the Store Visits “Overview” looks like:
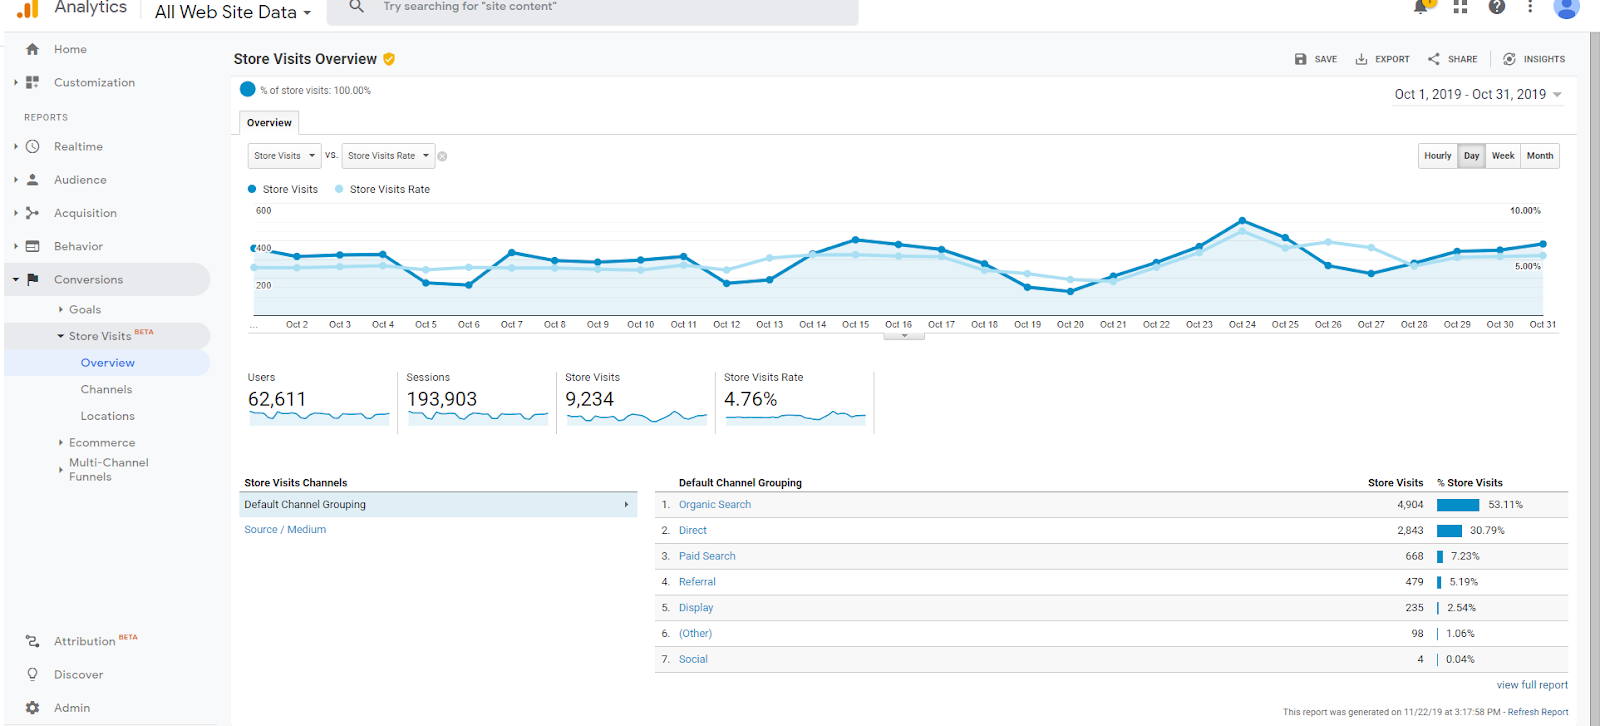
We see “Users”, “Sessions”, “Store Visits”, and “Store Visit Rate.” Store Visits are simply the number of people who entered a physical location after visiting your website in a set timeframe (in this case, the month of October). The Store Visit Rate, however, is a little more complicated.
Google tells us that Store Visit Rate is the number of store visits divided by the number of sessions. This doesn’t actually provide much information to digital marketers until it is broken down further.
Click “Channels” and “Default Channel Grouping” appears:
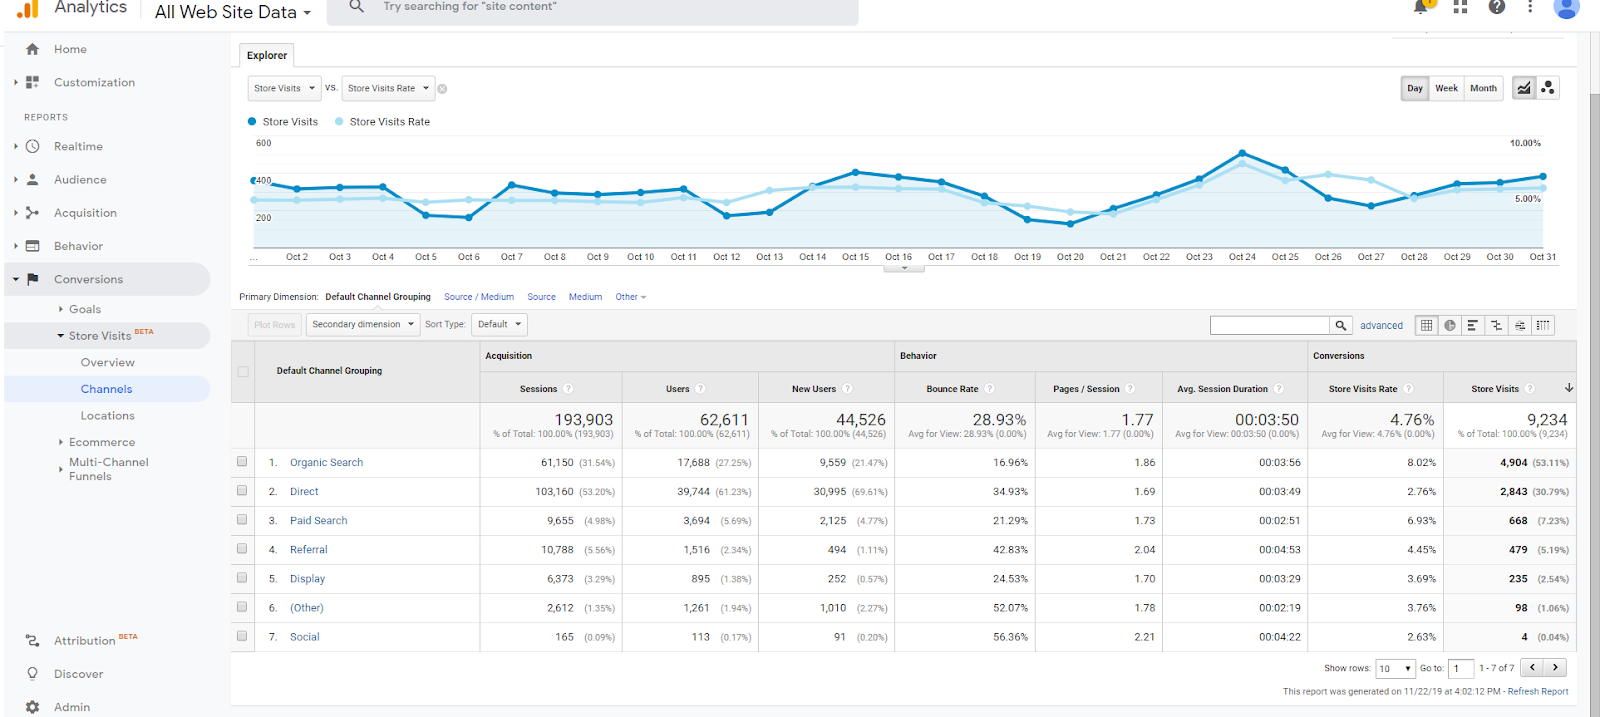
Now you’re able to see what the location visitor saw online before entering the branch. In the example above, 4,904 people visited the branch after an organic search. The Store Visit Rate for organic searchers was 8.02%.
Credit unions will want to investigate what channels most successfully bring people in the door, and potentially make creative and strategic changes to their digital marketing methods to increase ROI.
Does Your Credit Union Qualify for Store Visits Tracking?
According to Google, Store Visits tracking is still in beta testing, and is now generally available to Google Analytics 360 users. That said, not every organization will qualify to use the feature.
Google lists several technical requirements that must be followed to enable store visits tracking including activating Google Signals and linking Google Analytics, Google Ads, and Google My Business Accounts. But it is important to note that organizations also must have more than one physical location in order to set up tracking.
Keep These Caveats in Mind
Google calls this Store Visit data an estimate. This is not an exact science because foot traffic will only be reported when visitors have their location enabled on their mobile device. Additionally, a person who visits the physical location multiple times in a 30 day period after one website session will be counted for each visit, which can skew the numbers.
Most importantly, Store Visits cannot report what happened when a person visited the physical location. The data reported is anonymous and not tied to individual people, so the activities are not reported. There is no way to tell if a visitor came in to deposit $100 cash or took out a $20,000 auto loan.
The Big Picture about Store Visits for Credit Unions
Overall, Store Visits data allows digital marketers to watch trends and make strategic changes based on those trends. Smart credit unions will look at this metric to see which channels and campaigns drive the most branch visits. With the help of Store Visits data, they will be able to evaluate their digital marketing methods to determine what motivates people to come in the door.


Agree, disagree, or just have something to add?
Leave a comment below.