

Credit union marketers can spend hours (or longer) looking at data and analyzing its meaning. Some of this data is meaningful, while certain metrics aren’t much more than distractions from the big picture. It takes an expert to determine what metrics matter for your organization.
Once you scout out the important metrics, how do you know if what you’re seeing is considered “good”? At WebStrategies, we are often asked, “Is this normal? What is the average for the credit union industry?”
The WebStrategies 2019 Annual Benchmark Report
That is why create an annual benchmark report to take a look at metrics that are important to credit unions. This report compiles data from all of our credit union clients to determine what averages for bounce rate, traffic source, demographic information, and more.
In this blog series, we will more closely examine the following metrics from 2019 and explain what they mean for credit unions:
1. How long does the average visitor spend on a credit union website?
2. How likely is someone to come to a credit union website and leave without looking at more than one page?
3. Where does the average credit union website’s traffic come from?
4. How much has the average credit union’s organic traffic grown year over year?
5. What is the average age distribution of traffic on a credit union’s website?
6. What’s the average breakdown of mobile versus desktop traffic on a credit union website?
7. How long does it take the average credit union website to load?
8. What is the average completion rate of a credit union loan application?
What You Need to Know about Site Engagement Metrics
Before we begin, please note that these are all site engagement metrics. Marketing decisions should not be made based solely on these metrics because they do not show conversion data - and credit unions should remain focused on growing membership and increasing loan applications.
However, credit union marketers can use this data to see how their credit unions measure up to others in the industry. You will be able to get a sense of pain points that are personal to your credit union and pain points that are shared across the industry. It is helpful to have this information and understand it, but, as previously noted, don’t let these stats distract from the bigger picture.
Average Session Duration for Credit Union Clients in 2019
 To begin, we will take a look at the average time users spend on credit union websites. Google Analytics calls this average session duration.
The average time spent on credit union websites in 2019 was 2 minutes and 19 seconds. This is basically flat from our 2018 survey which found an average session duration of 2 minutes and 13 seconds.
It is important to note that this time may not include time spent in the online banking site or in loan applications. It depends how the credit union has tracking set up.
What Does Average Session Duration Mean for Your Credit Union?
If 2 minutes and 19 seconds sounds low to you, think about it this way: a short time on site is not necessarily a bad thing. It could mean your site is doing exactly what it is set up to do: lead users to conversions. If a user spends a minute or two on your site before leaving the site to fill out a loan application, this is a major win.
On the flip side, credit union that are investing heavily in content might aim for longer times spent on the site. If you are a content-heavy site that has a session duration of 30-40 seconds, this should be a red flag.
How to Find the Average Session Duration for Your Credit Union
Do you want to find session duration for your credit union? Follow these steps in Google Analytics:
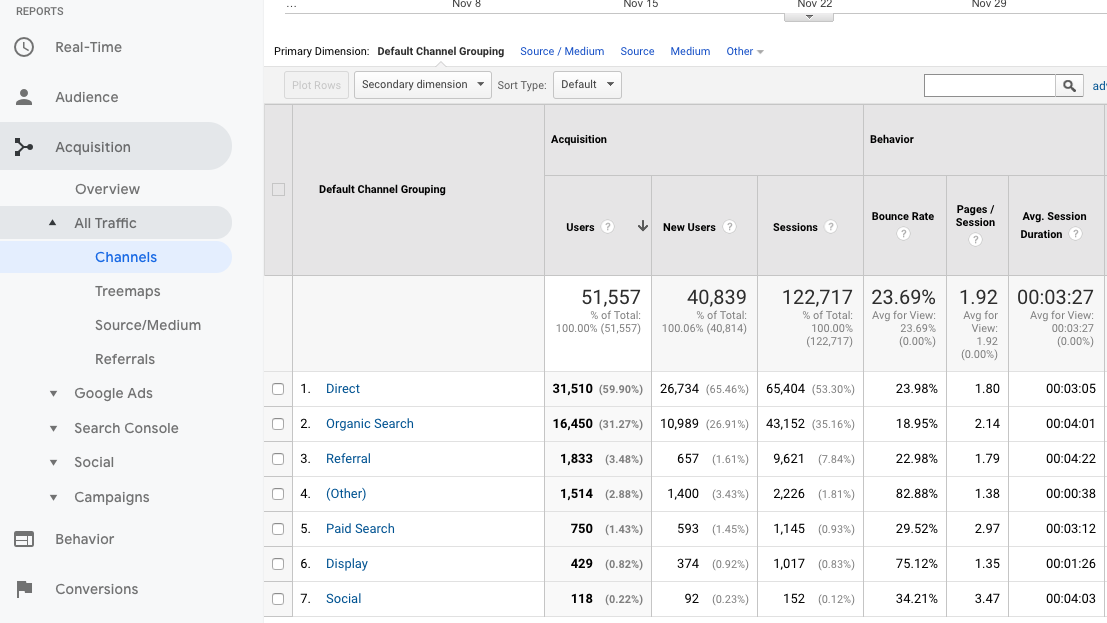
- Click Acquisition
- Click All Traffic
- Click Channels
- Average Sessions Duration is found under the “Behavior” heading.
Is your credit union’s average session duration higher or lower than the average for our credit union clients? What does that tell you about your website? Is your site working as it is intended and leading users to fill out loan applications? Think through these questions but don’t go overboard analyzing one isolated metric.
In the next post, we will look at bounce rate, or the number of people who leave your site after visiting just one page. This metric is closely related to average session duration, and will help you glean further insight about how users engage with your site. Be sure to follow this WebStrategies blog series to gain access to further site engagement data in the credit union industry.


Agree, disagree, or just have something to add?
Leave a comment below.